See all tags.
Tagged “svg”
Getting started creating SVG Graphics
posts |
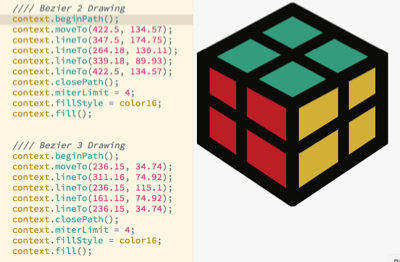
A lot of data visualizations use the SVG format to create graphics, so in this article, we'll use SVG to create some basic shapes and graphics. Understanding how the format works will help you when you're using SVG based libraries and frameworks.

Vector Graphic Formats Used for data visualizations
posts |
In this article, I'll talk about the different graphic formats used for visualizing data and examine some of the differences. Since most visualizations are handled in just a few different vector graphic formats, we'll see why using vectors has advantages over bitmaps because it allows us to illustrate as well as create interactions with very little overhead.